Environmental measurement network
ALPS
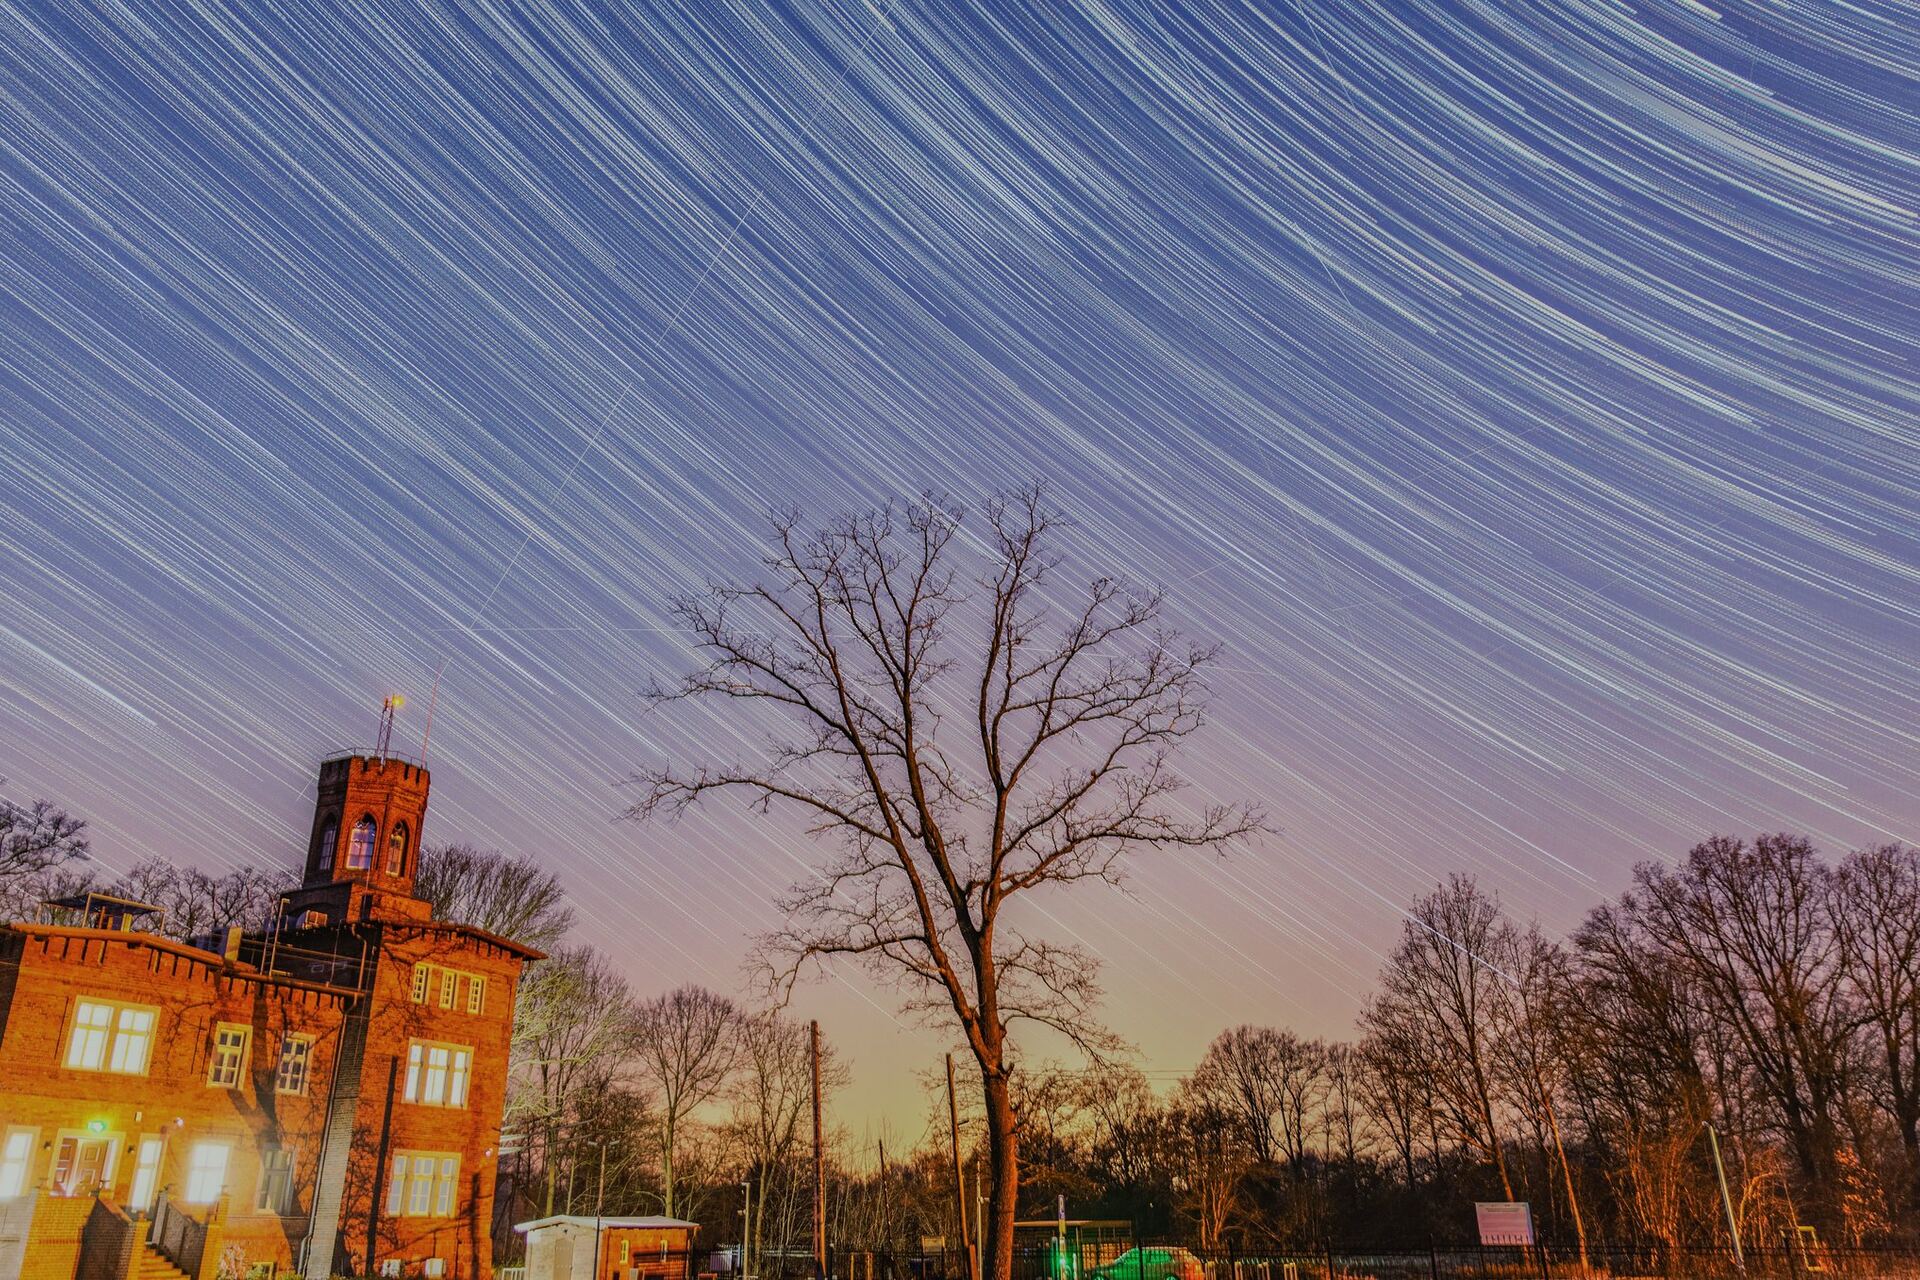
A live network view combining station availability, all-sky imagery, SQM readings and environmental measurements.
- Software
- Systems
- Delivery
01 / Context
Problem
Measurements from distributed observing stations need to be understandable both as live operational status and as evidence of changing night-sky conditions.
02 / Scope
My responsibility
I independently delivered the current public website. The broader ALPS measurement system, station hardware and scientific programme are a team effort.
03 / System
How it works
A deliberately simplified view of system boundaries and data movement.
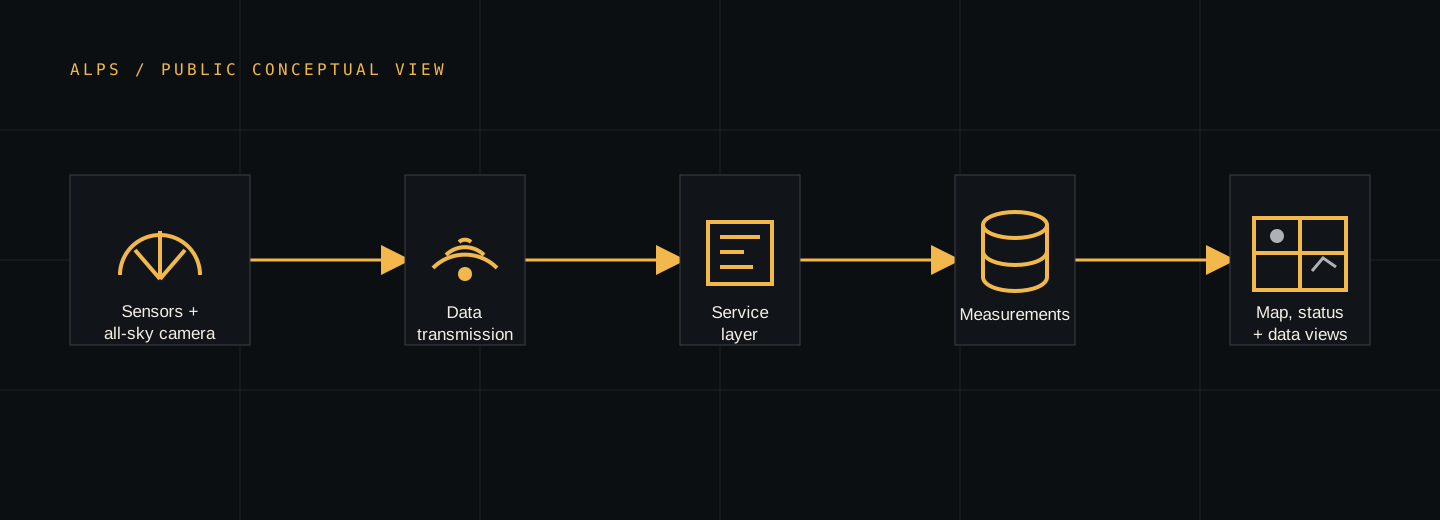
- 01Station sensors and all-sky camera
- 02Data transmission
- 03Service layer
- 04Time-series measurement storage
- 05Public map, status and data views
04 / Delivery
What I built
- Designed and implemented the current public ALPS website.
- Brought station status, the network map and SQM measurements into one interface.
- Connected public views to time-series measurements stored in InfluxDB.
- Presented environmental context alongside images and night-sky brightness data.
- Contributed within the team developing the wider measurement system.
05 / Decisions
Constraints and trade-offs
- Operational status and scientific context have different audiences and must remain legible in the same interface.
- The site distinguishes individual delivery from shared ownership of the wider ALPS system.
06 / Tools
Project stack
The technologies used across the system, grouped by the job they perform.
Backend and data
Frontend and geospatial interface
-
JavaScript
Interactive status, measurement and navigation behaviour
-
Leaflet
Station map and geospatial presentation
-
Bootstrap / MDB
Responsive interface foundations