
Time-series and observational data
Scientific Data Processing
A connected body of work spanning space-telescope photometry, time-series analysis, Fourier methods and spectroscopic preparation.
- Data
- Software
01 / Context
Problem
Large observational datasets only become useful after consistent extraction, quality control, candidate selection and domain-specific analysis.
02 / Scope
My responsibility
I processed and analysed space-telescope data, including light curves from NASA's TESS mission, reduced the candidate set and prepared observational material for scientific interpretation.
03 / System
How it works
A deliberately simplified view of system boundaries and data movement.
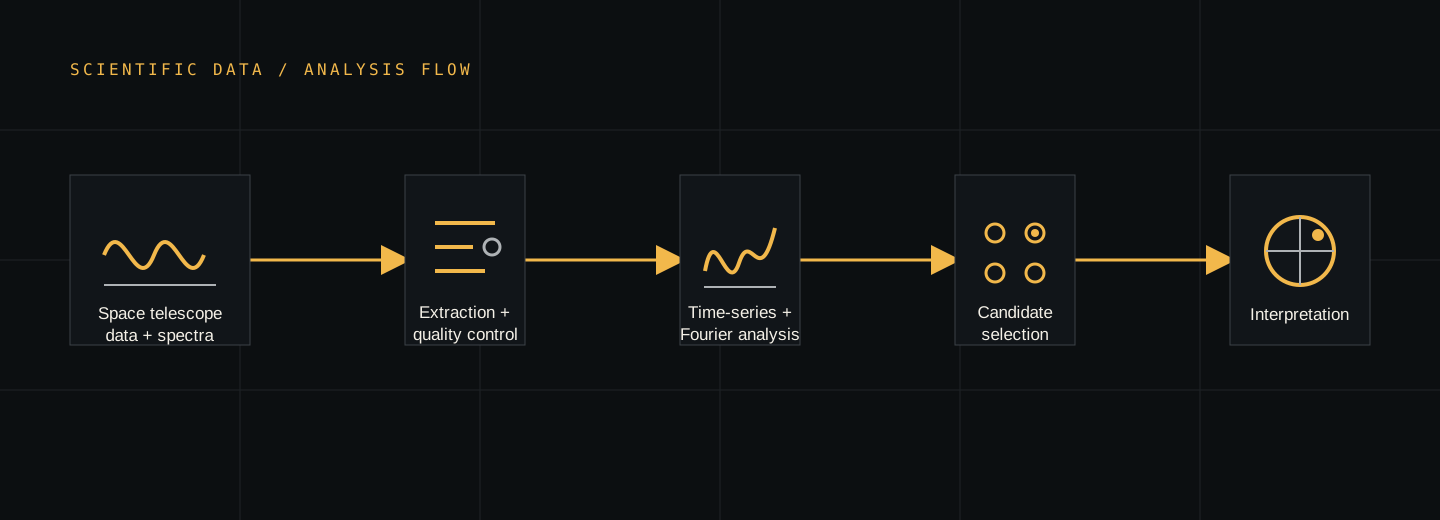
- 01Space telescope data and spectra
- 02Extraction and quality control
- 03Time-series and Fourier analysis
- 04Candidate selection
- 05Scientific interpretation
04 / Delivery
What I built
- Processed and analysed the full stellar light-curve dataset.
- Reduced the dataset to a scientifically focused candidate set.
- Applied Fourier analysis to identify and characterise variability.
- Prepared spectroscopic material for analysis.
- Built and maintain lcView, a Python workbench integrating native C and Fortran engines for light-curve analysis.
05 / Decisions
Constraints and trade-offs
- Automated screening provides scale, while final candidate selection still requires scientific judgement.
- Combining datasets with different cadence and baselines requires careful separation of comparable and complementary evidence.
06 / Tools
Project stack
The technologies used across the system, grouped by the job they perform.
Application
-
Python
Analysis workflows and application architecture
-
PySide6 / Qt
Interactive lcView desktop workbench
-
pyqtgraph
Responsive scientific plotting
Scientific computing
-
NumPy
Numerical arrays and transformations
-
SciPy
Scientific algorithms and model fitting
-
pandas
Tabular data preparation
-
Astropy
Astronomical data structures and calculations
-
Matplotlib
Publication and diagnostic visualisation
Native code and quality
-
C
Native numerical backend
-
Fortran
Integrated legacy analysis engines
-
pytest
Numerical, parsing and UI tests
-
GitHub Actions
Automated cross-platform CI checks